节作者:Rebecca Vederhus, Sebastian Jentschke
From SPSS to jamovi: Non-parametric analyses
This comparison shows how a Mann-Whitney test is conducted in SPSS and jamovi. The SPSS test follows the description in chapter 7.4.3 in Field (2017), especially figure 7.6 - 7.8 and output 7.2. It uses the data set Drug.sav which can be downloaded from the web page accompanying the book.
| SPSS | jamovi |
|---|---|
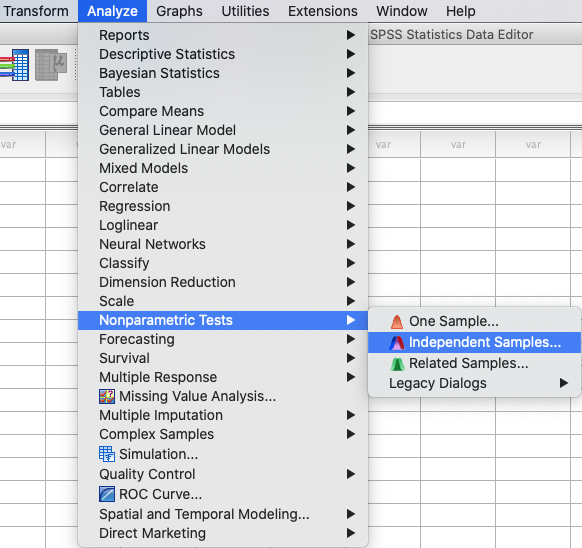
In SPSS, a Mann-Whitney test can be run using: Analyze → Nonparametric
Tests `` → ``Independent Samples. |
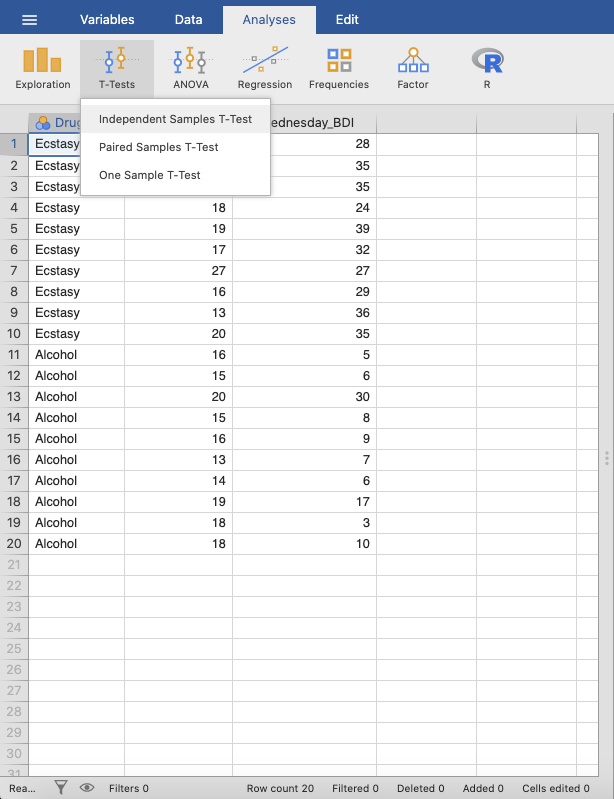
In jamovi this is done using the following steps: Analyses → T-tests
→ Independent Samples T-Test. |
 |
 |
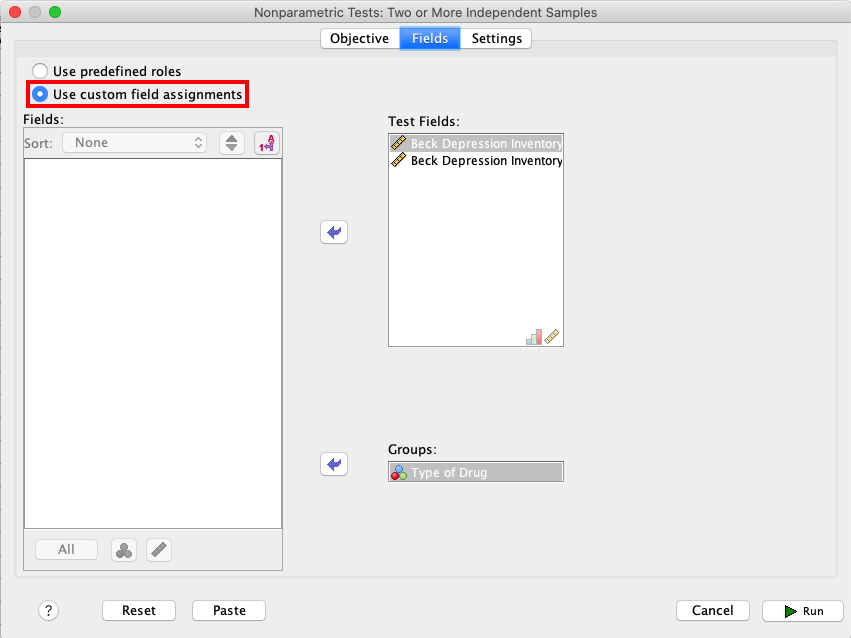
In SPSS, choose Fields from the menu. Then, click Use custom field
assignments and move the variables Sunday_BDI and Wednesday_BDI to
Test Fields, and the variable Drug to Groups. |
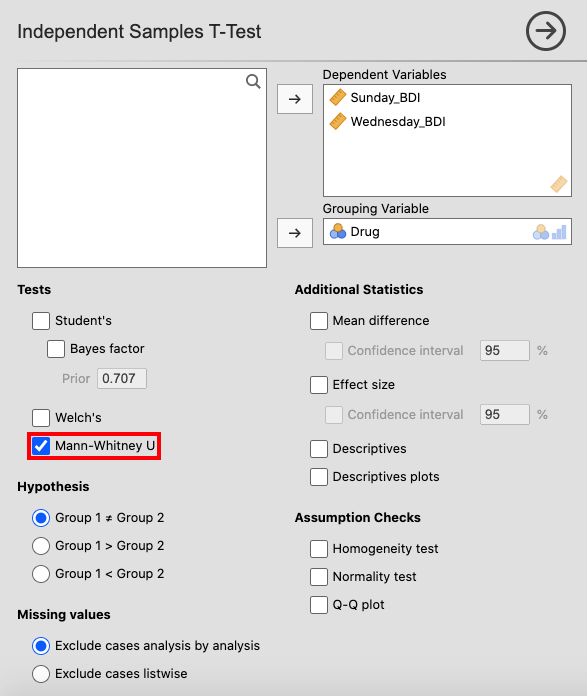
In jamovi, move Sunday_BDI and Wednesday_BDI to the Dependent
Variables variable box, and Drug to the Grouping Variable box.
Then, tick the box for Mann-Whitney U. |
 |
 |
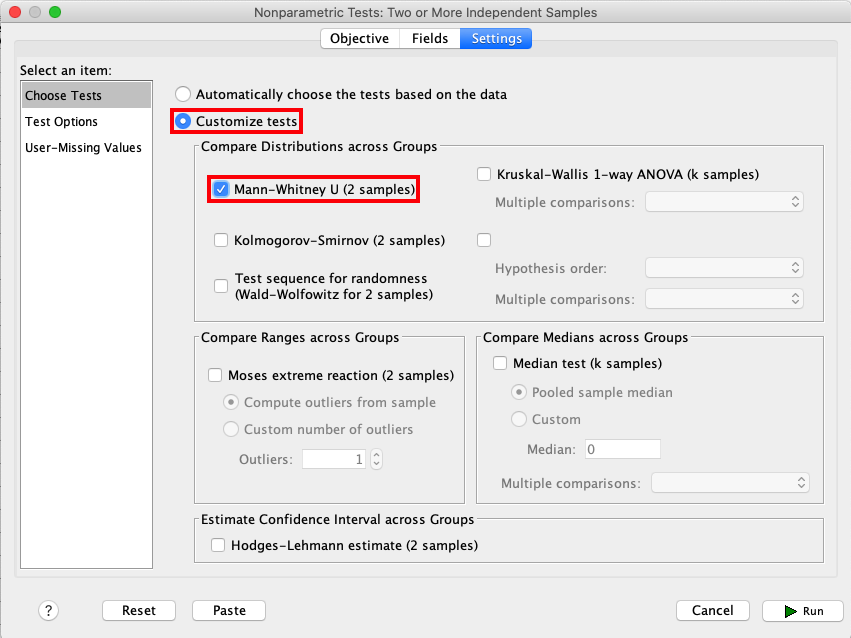
Open the Settings window, and click Customize tests. Tick the box for
Mann-Whitney U (2 samples). |
|
 |
|
| By comparing the output from SPSS and jamovi, you can tell that some of the results are the same. The results in jamovi are presented in a single table, while in SPSS you have to double-click the table in order to get the rest of the results. | |
|
 |
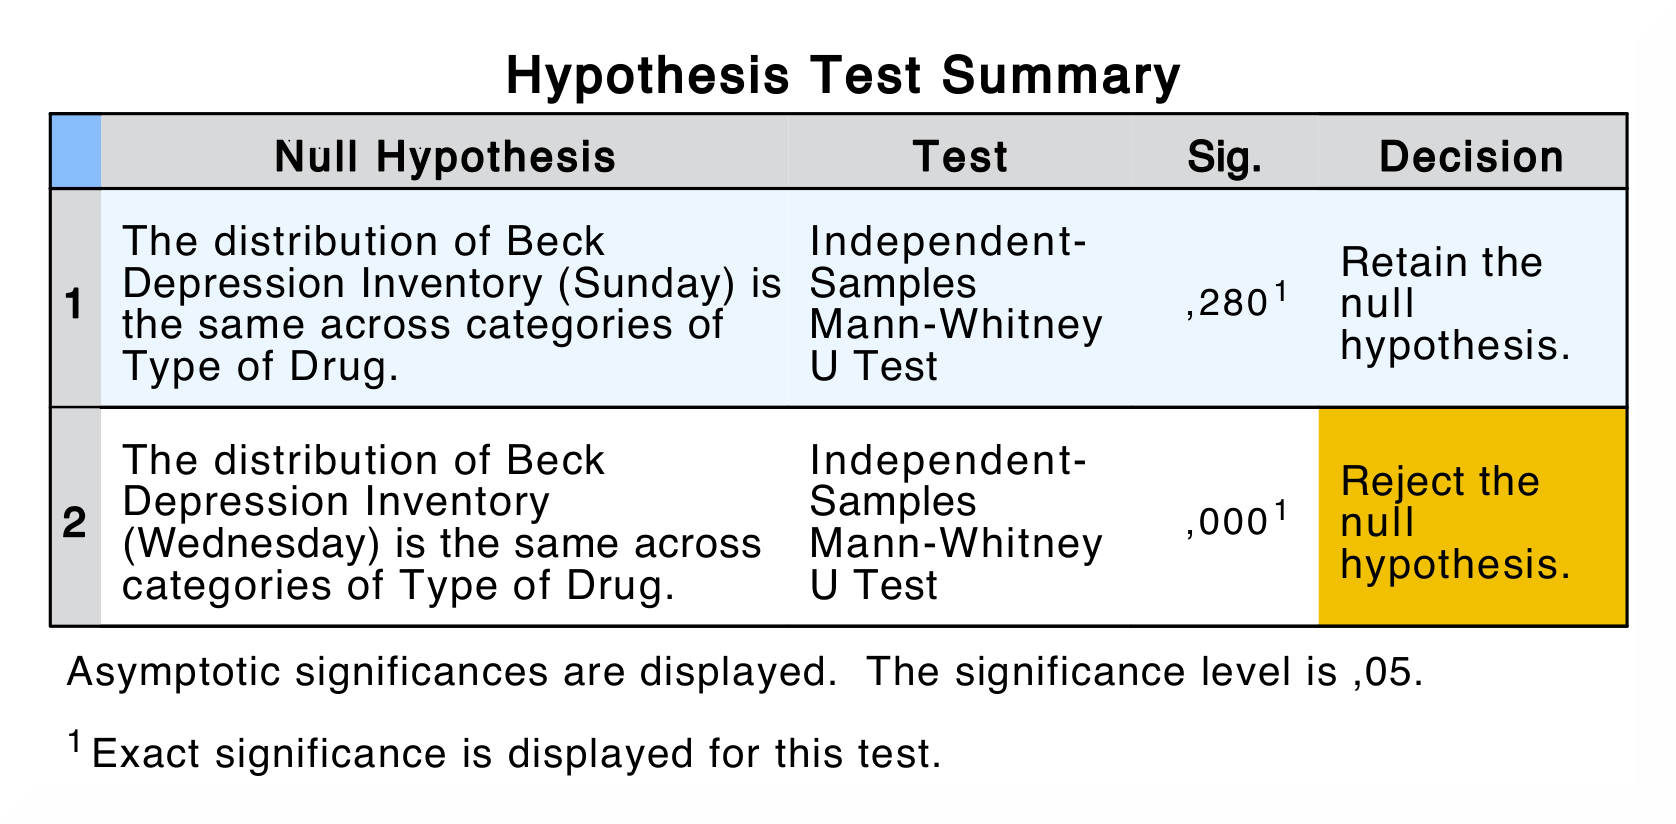
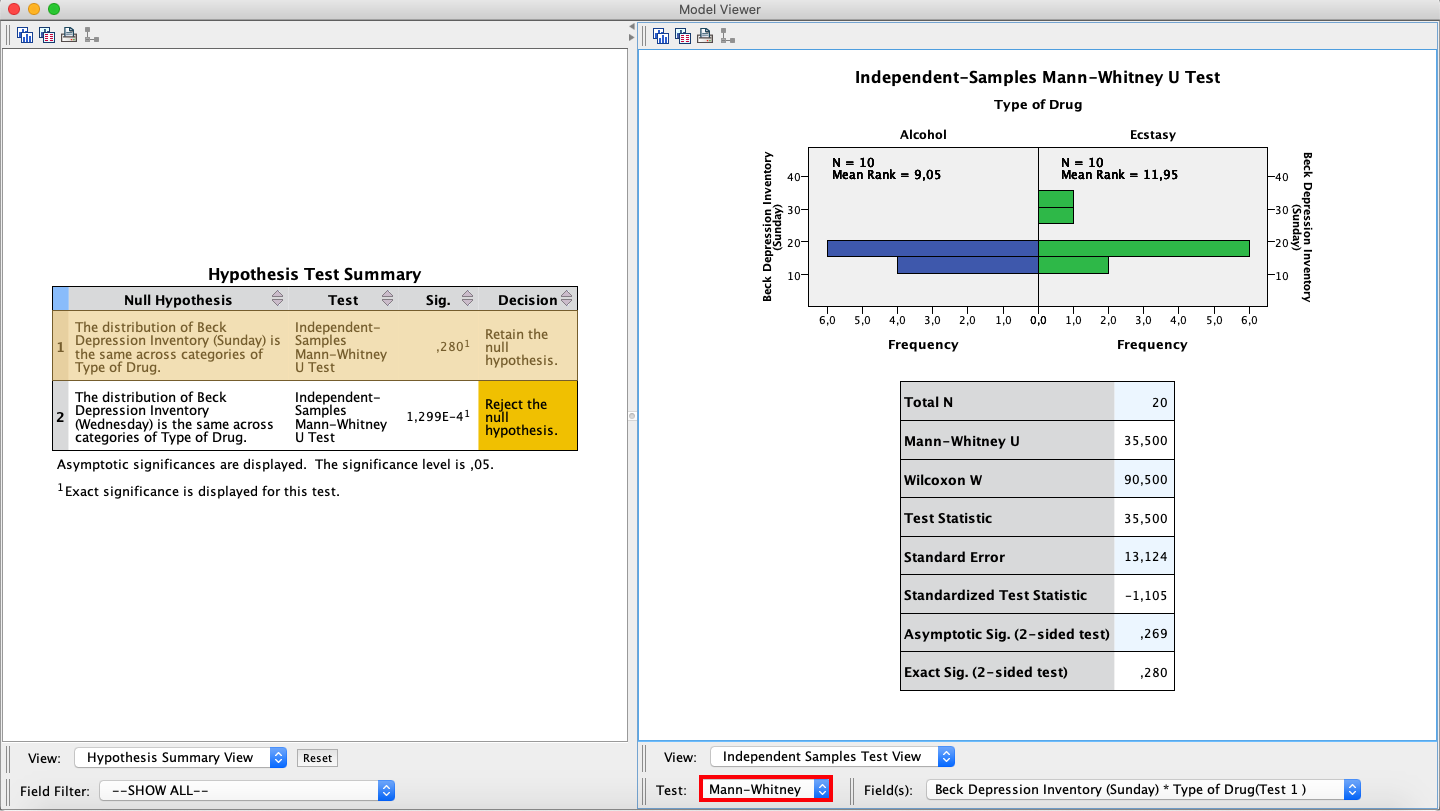
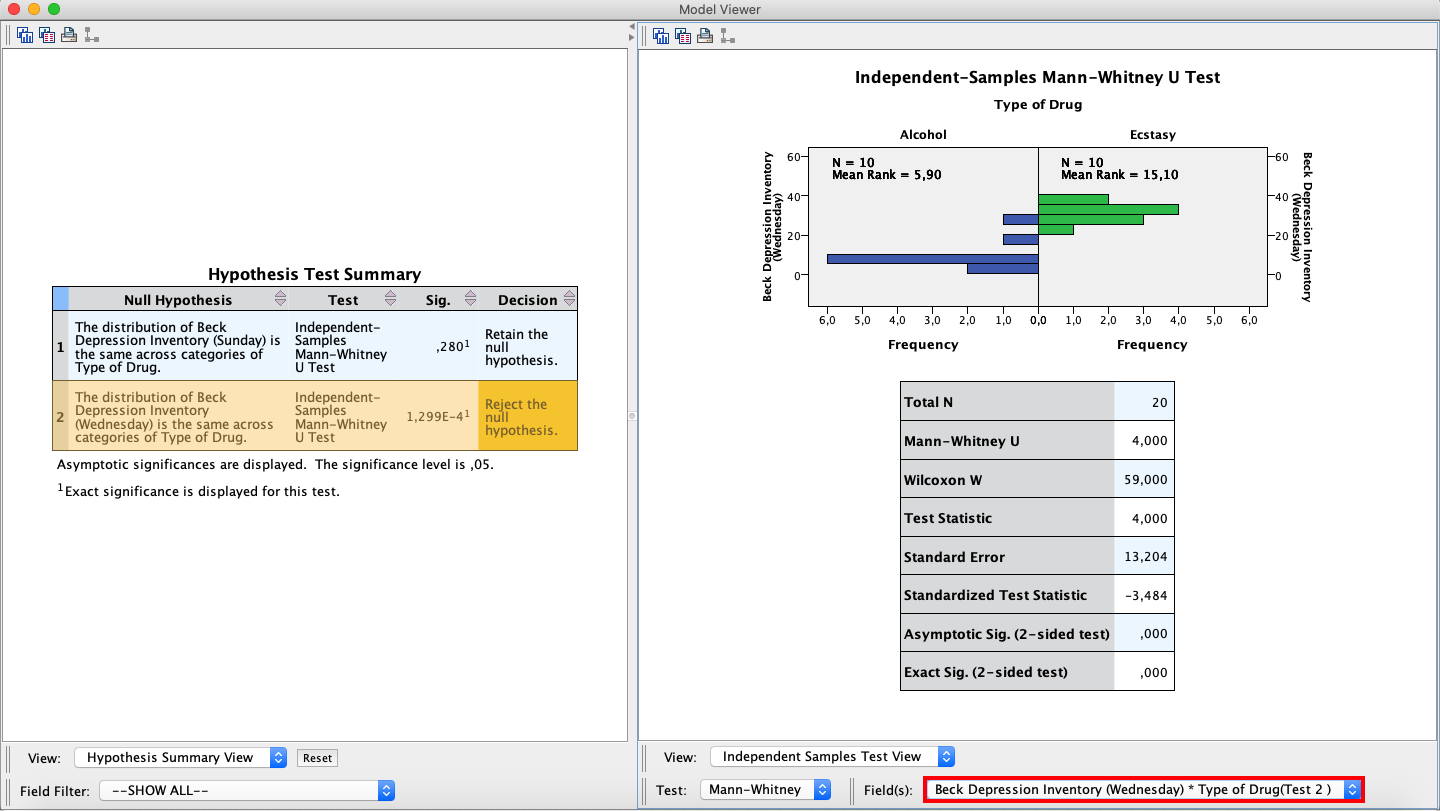
In SPSS, the first table is the Hypothesis Test Summary, which only shows
the significance value. If you double-click this table you open the model
viewer window, which contains the details of the analysis. To view the
results for the Wednesday sample, select Beck Depression Inventory
(Wednesday) \* Type of Drug(Test 2) in the drop-down menu next to
Field(s). |
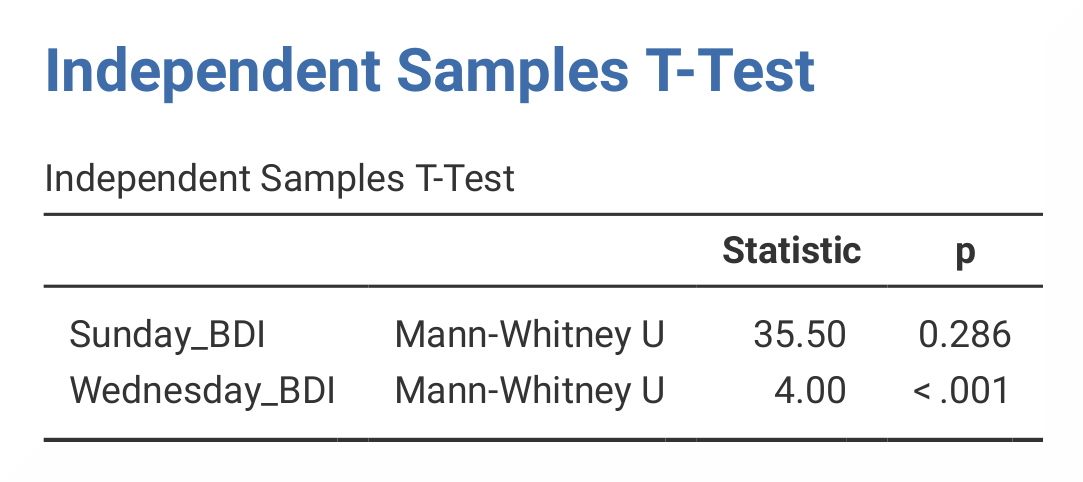
In jamovi, results are presented in the Independent Samples T-Test table.
Here the U-value is found in the first column, and its significance level
in the second column. |
The output in jamovi only presents the Mann-Whitney U statistic and its significance value, while SPSS presents values for The numerical values for the Wednesday group are the same in SPSS and jamovi (U = 4.00, p < .001), while the values for the Sunday group differ slightly (U = 35.50, p = .280 vs. p = .286). The reason for the difference is that jamovi applies continuity correction (where a discrete distribution – ranks – is approximated via a continuous one – the standard normal distribution) whereas SPSS doesn’t. |
|
| If you wish to replicate those analyses using syntax, you can use the commands below (in jamovi, just copy to code below to Rj). Alternatively, you can download the SPSS output files and the jamovi files with the analyses from below the syntax. | |
NPTESTS
  /INDEPENDENT TEST (Sunday_BDI Wednesday_BDI) GROUP (Drug) MANN_WHITNEY
  /MISSING SCOPE=ANALYSIS USERMISSING=EXCLUDE
  /CRITERIA ALPHA=0.05 CILEVEL=95.
|
jmv::ttestIS(
    formula = Sunday_BDI + Wednesday_BDI ~ Drug,
    data = data,
    students = FALSE,
    mann = TRUE)
|
| SPSS output file containing the analyses | jamovi file with the analyses |
References
Field, A. (2017). Discovering statistics using IBM SPSS statistics (5th ed.). SAGE Publications. https://edge.sagepub.com/field5e